Web App · 2024 · Confidential — fuel station chain
Petrol Pump Chain Management
CompletedSales, stock, and reconciliation for a fuel station chain
Problem
Shift sales, nozzle readings, and tank stock lived in paper registers. Day-end reconciliation took hours, and variances between meter readings and actual stock surfaced too late to explain — and the books were kept separately from the operation that produced them.
Solution
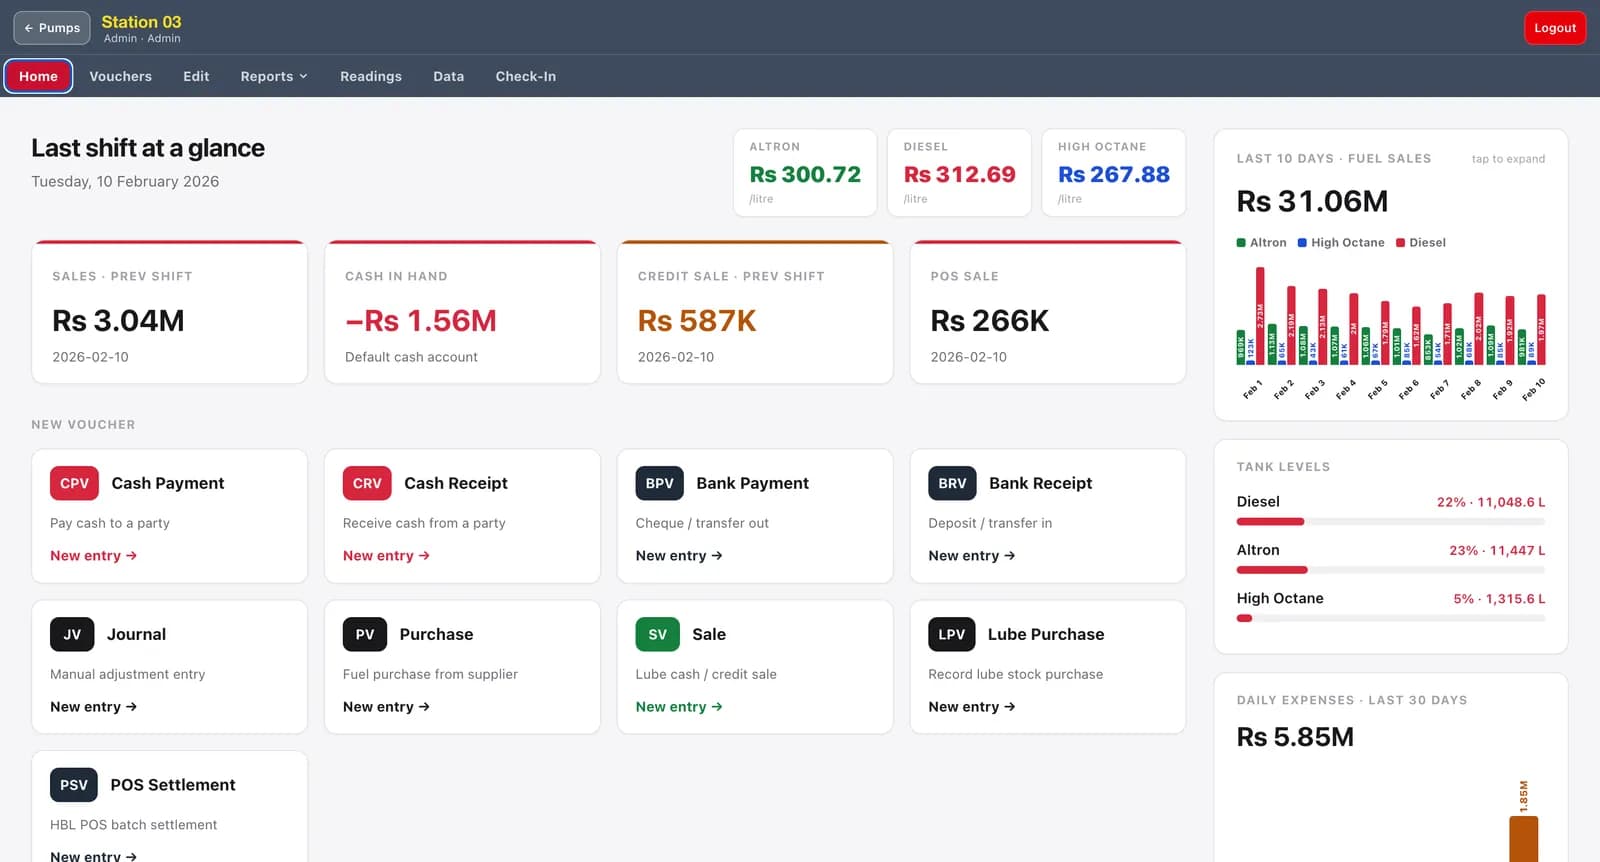
A web app the chain runs every shift on: nozzle opening/closing readings, tank dips, credit-customer ledgers, and staff accounts — on top of a full double-entry accounting layer, so the day-close and the trial balance come from the same entries.
Outcome
- TODO: time saved on day-close per station
- TODO: variance/shrinkage reduction after rollout
- Every shift closes against the meters, so discrepancies are caught while the shift staff is still on site
Background
The client runs a chain of fuel stations, and ran them the way most do: paper registers per pump, a day-end tally, and a manager reconciling meter readings against cash and stock long after the shift that produced them had gone home. Honest mistakes and real losses looked identical by then. The accounts were a separate exercise again — books written up from the same registers, days later, by someone who hadn't been there.
What I built
A web application shaped around how a station actually runs — the shift — sitting on a proper set of books.
The shift is the unit of truth
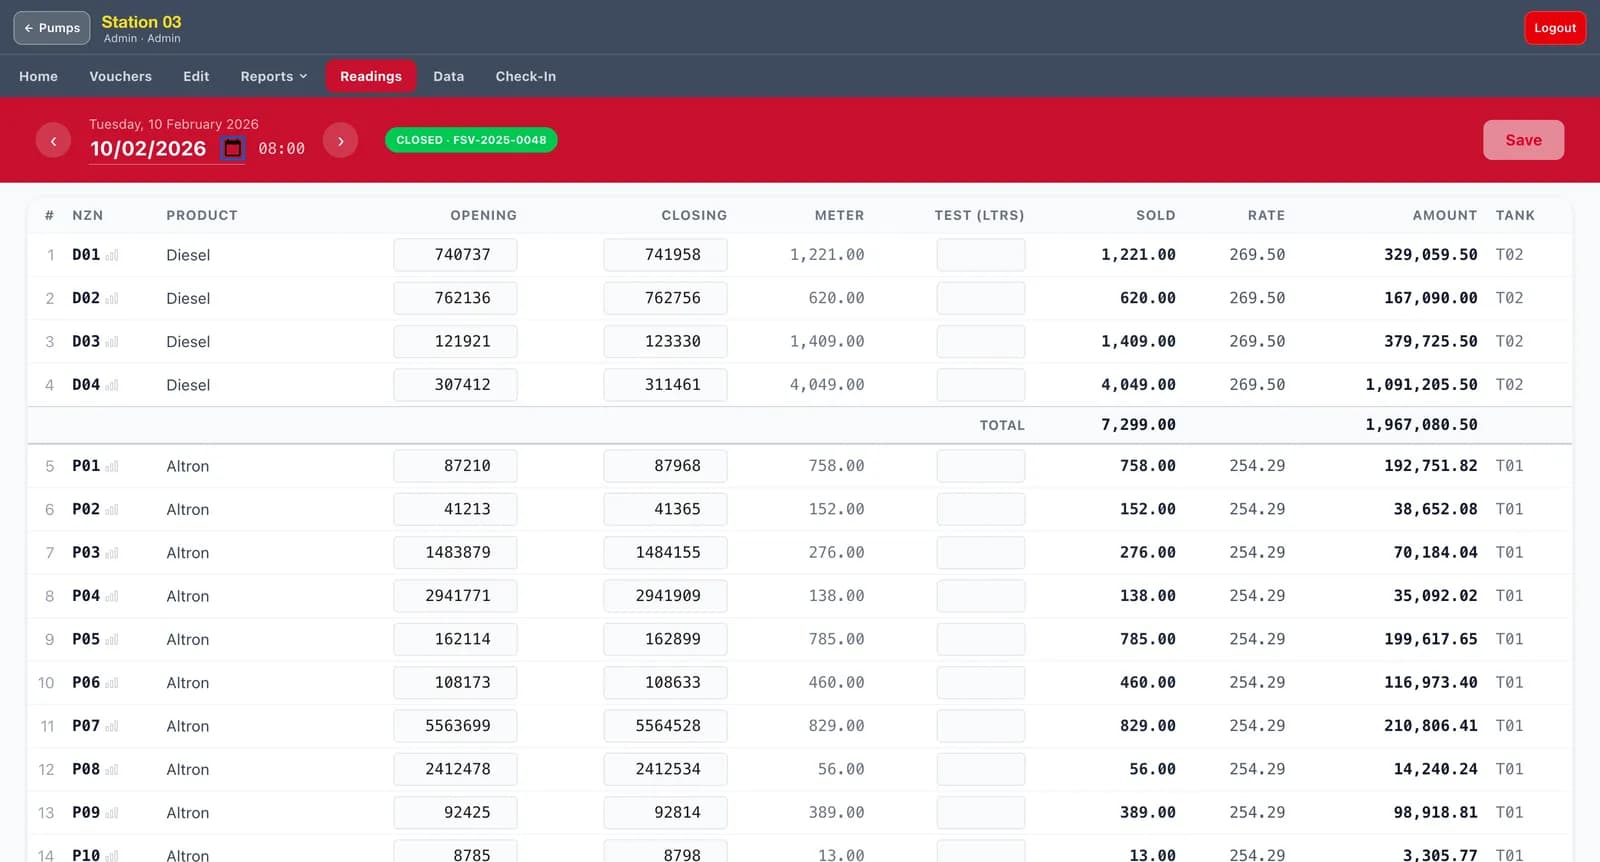
Staff open a shift by recording each nozzle's meter reading; they close it the same way. Litres sold is the difference, test litres come off the top, and the amount follows from the product's rate that day. Cash counted, credit issued, and expenses are entered against the same shift, so every rupee has to land somewhere.
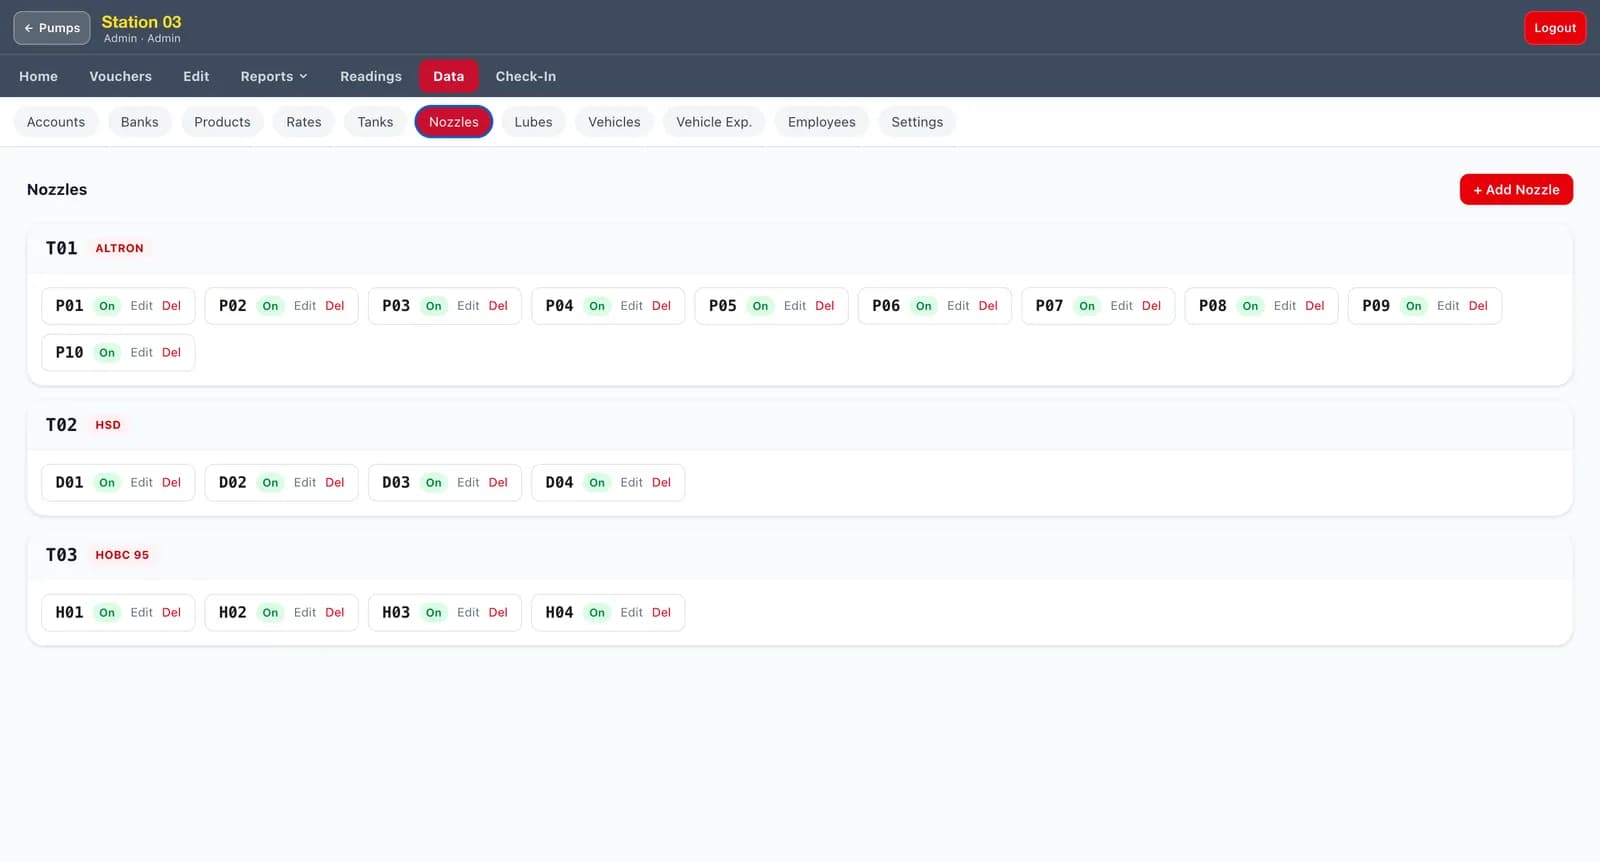
Each station is configured down to the physical hardware: tanks with their capacity and calibration chart, and the nozzles drawing off each one. A reading sheet is therefore the station's real layout, not a generic form — diesel nozzles roll up to the diesel tank, and the totals per product fall out of that.
Tank stock and reconciliation
Deliveries and daily readings track physical stock per tank against capacity. The app compares stock movement to metered sales, charts the difference over time, and raises a low-level alert before a tank runs dry. The difference between "we have a leak", "a meter is drifting", and "nothing to see" becomes a report instead of an argument.
Rates change, and the books have to know
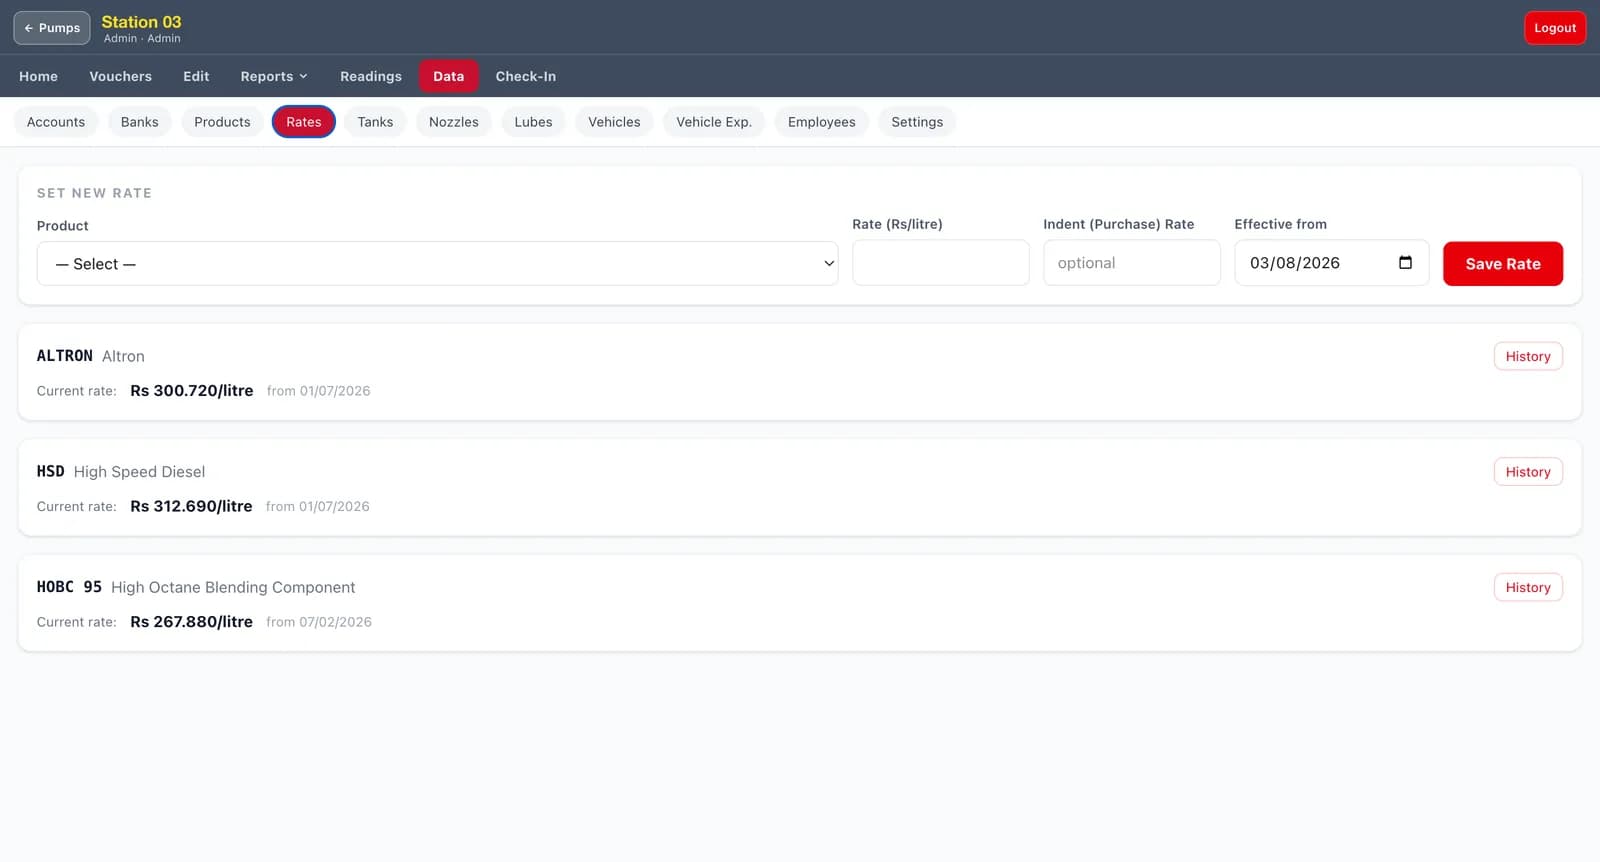
Fuel prices move on a schedule the station doesn't control. Rates are dated — sale rate and indent (purchase) rate per product, with full history — so a reading sheet is always priced at the rate in force on its own date, and re-pricing a past day is not a manual exercise.
Real double-entry underneath
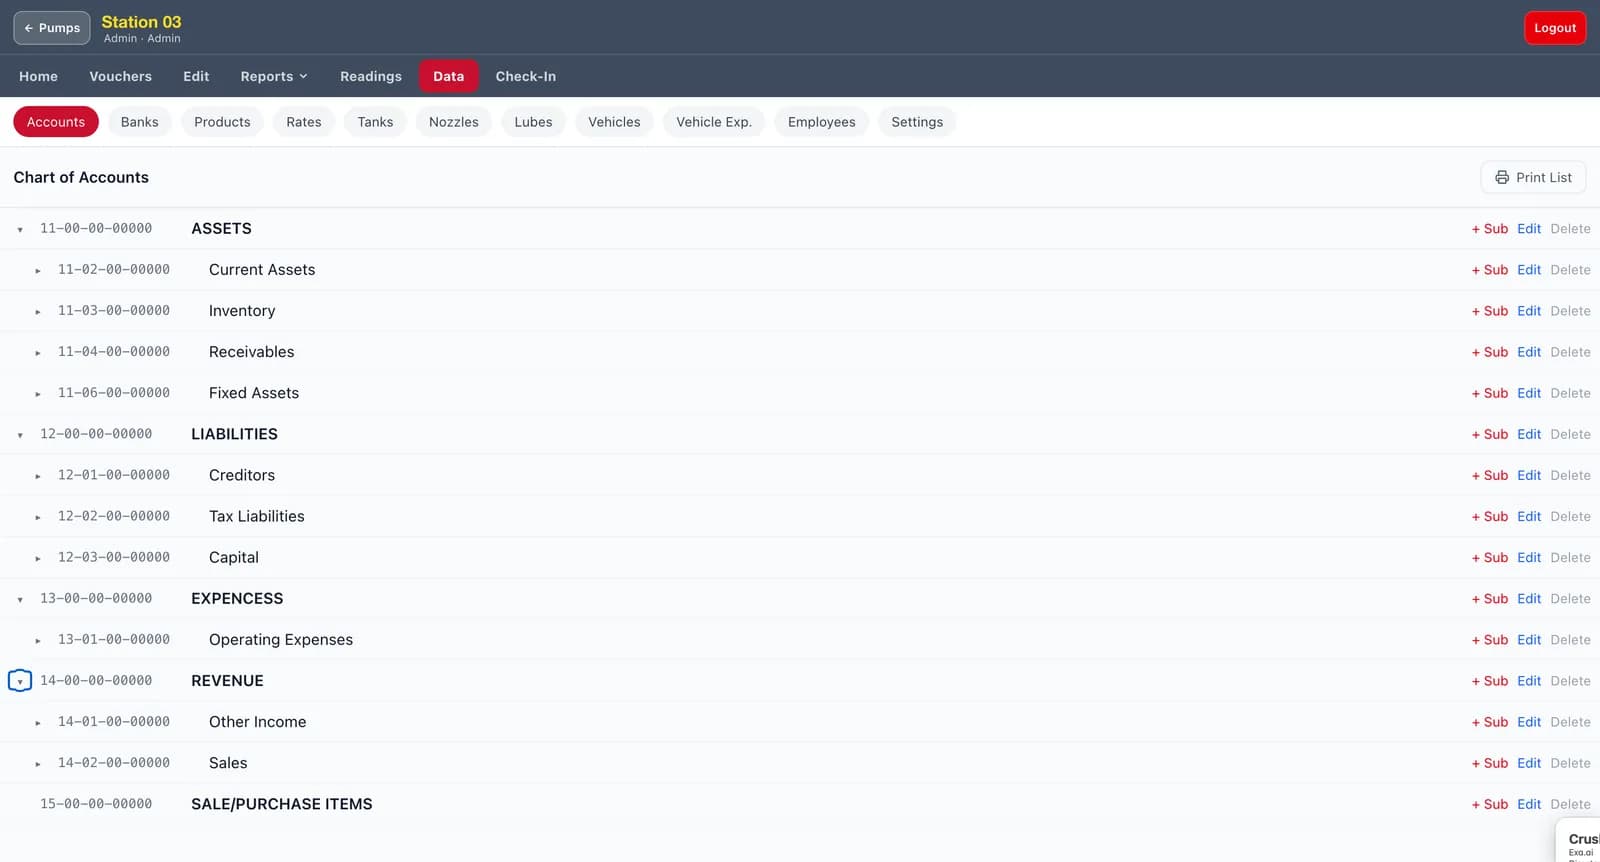
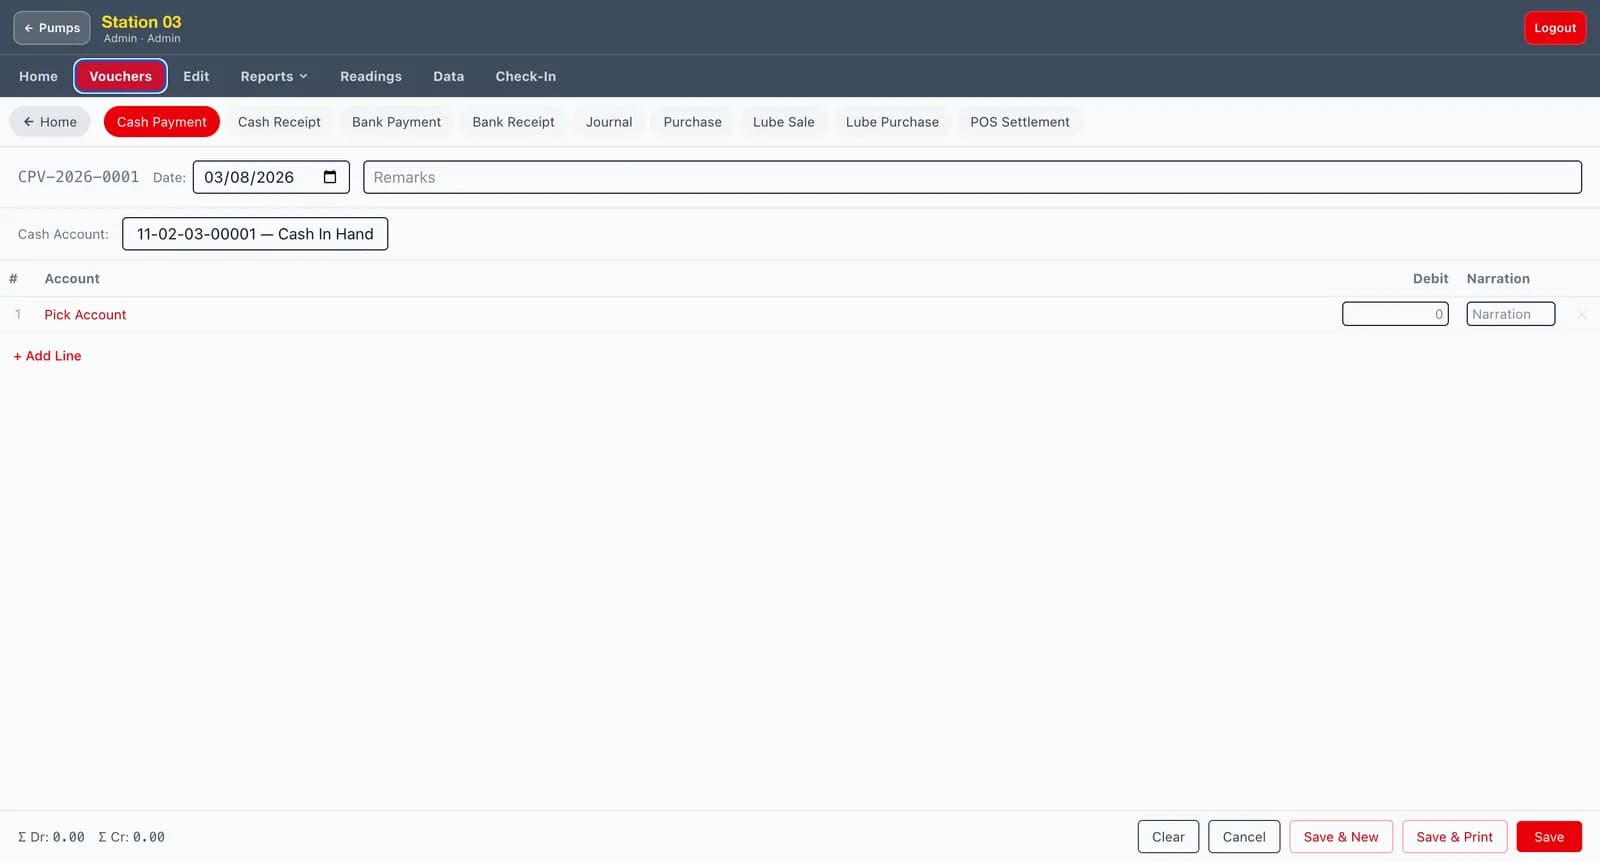
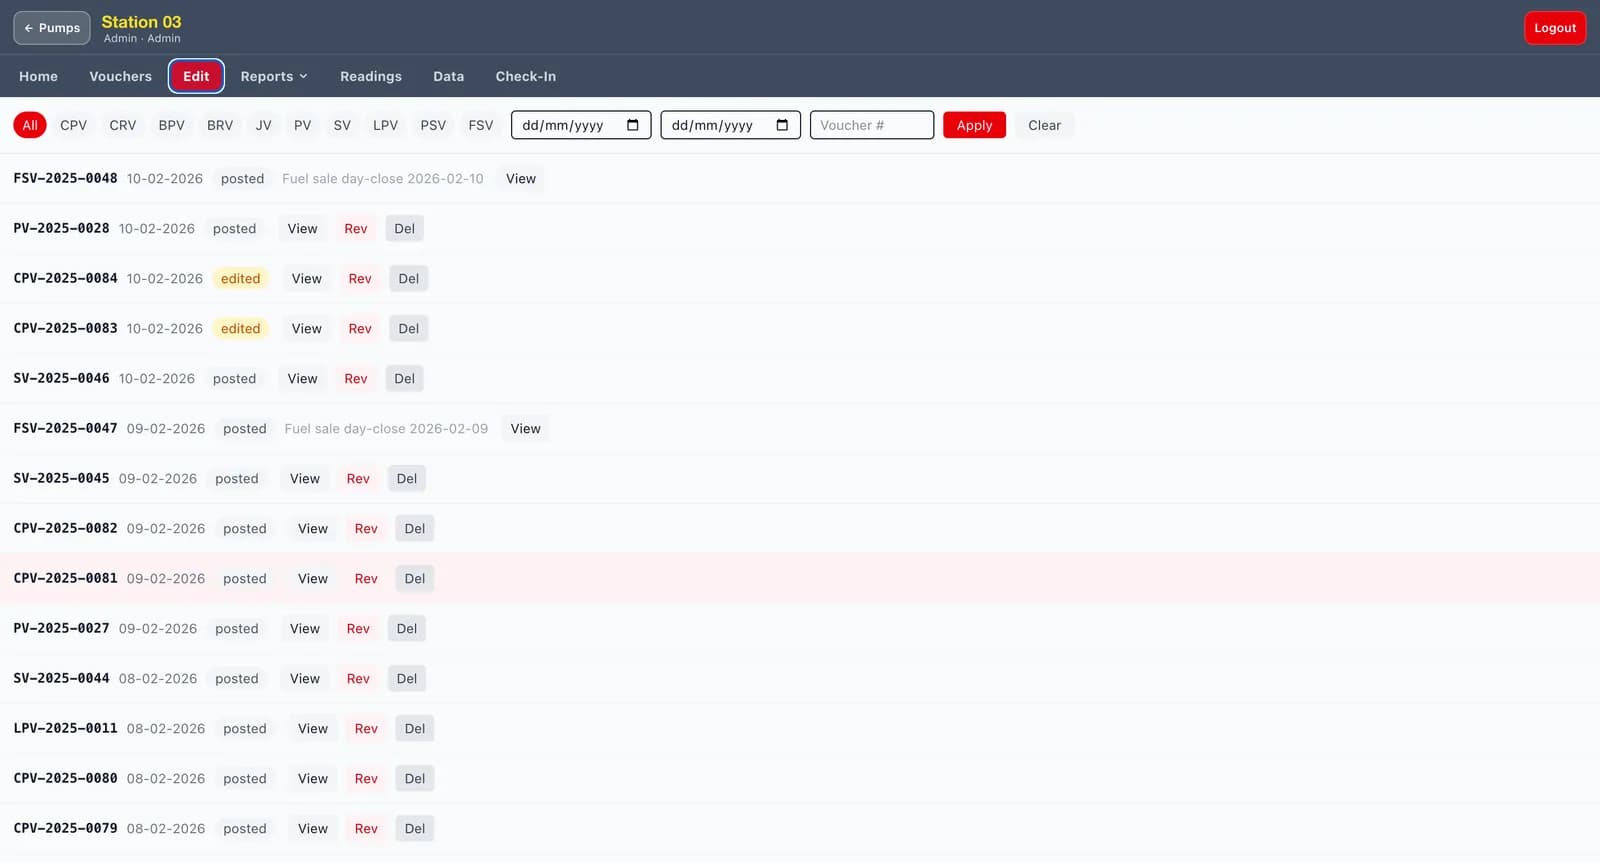
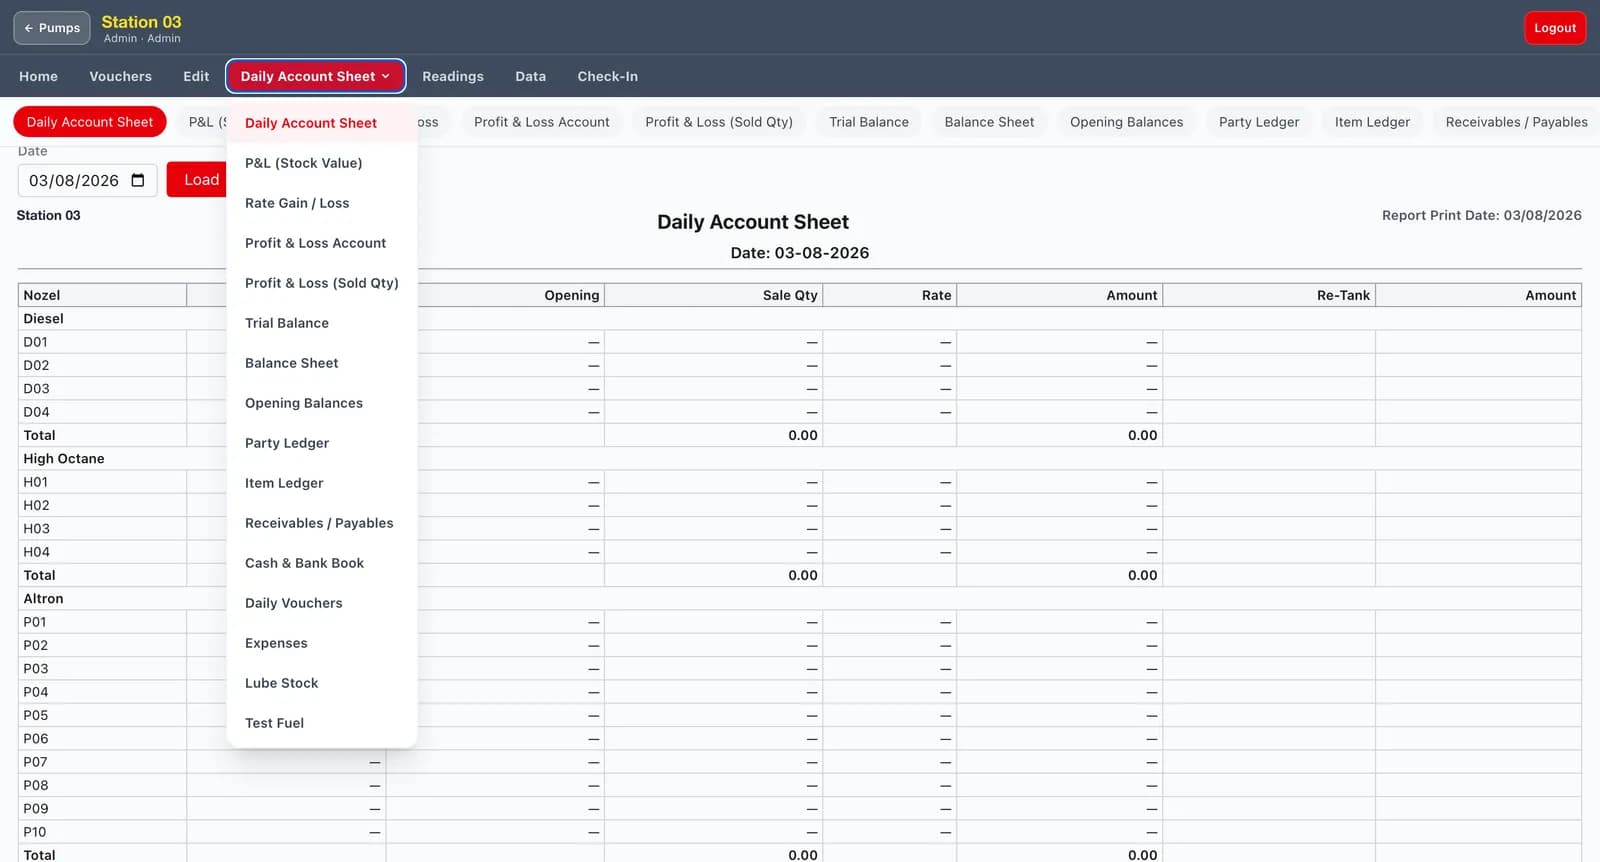
The operational side posts into an actual accounting system rather than a sales spreadsheet: a hierarchical chart of accounts, and cash, bank, journal, purchase, sale, lube, and POS-settlement vouchers. Every voucher is numbered, posted, and reversible with an audit trail — edits are marked rather than silently overwritten. Out of that come the reports an accountant expects: daily account sheet, trial balance, balance sheet, P&L (by stock value and by sold quantity), party ledgers, receivables/payables, and cash & bank book. The day-close and the trial balance are the same entries seen from two ends.
Credit customers
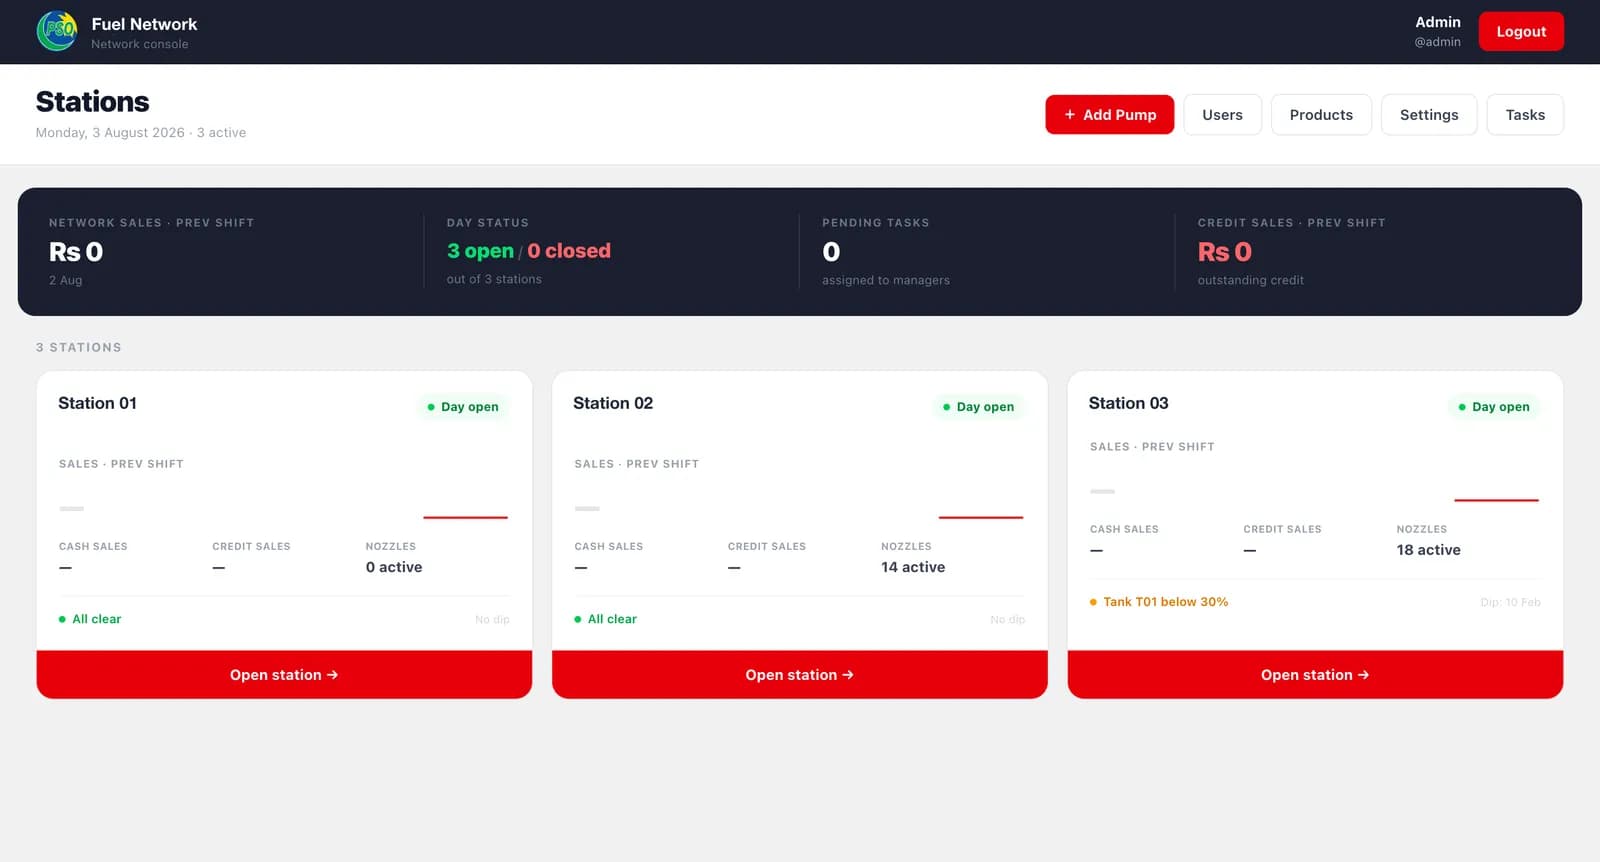
Fleet and commercial customers buy on credit. Each has a party ledger — sales accrue against it, settlements clear it, and the network console shows the chain's total outstanding credit at a glance.
Everything else a station sells
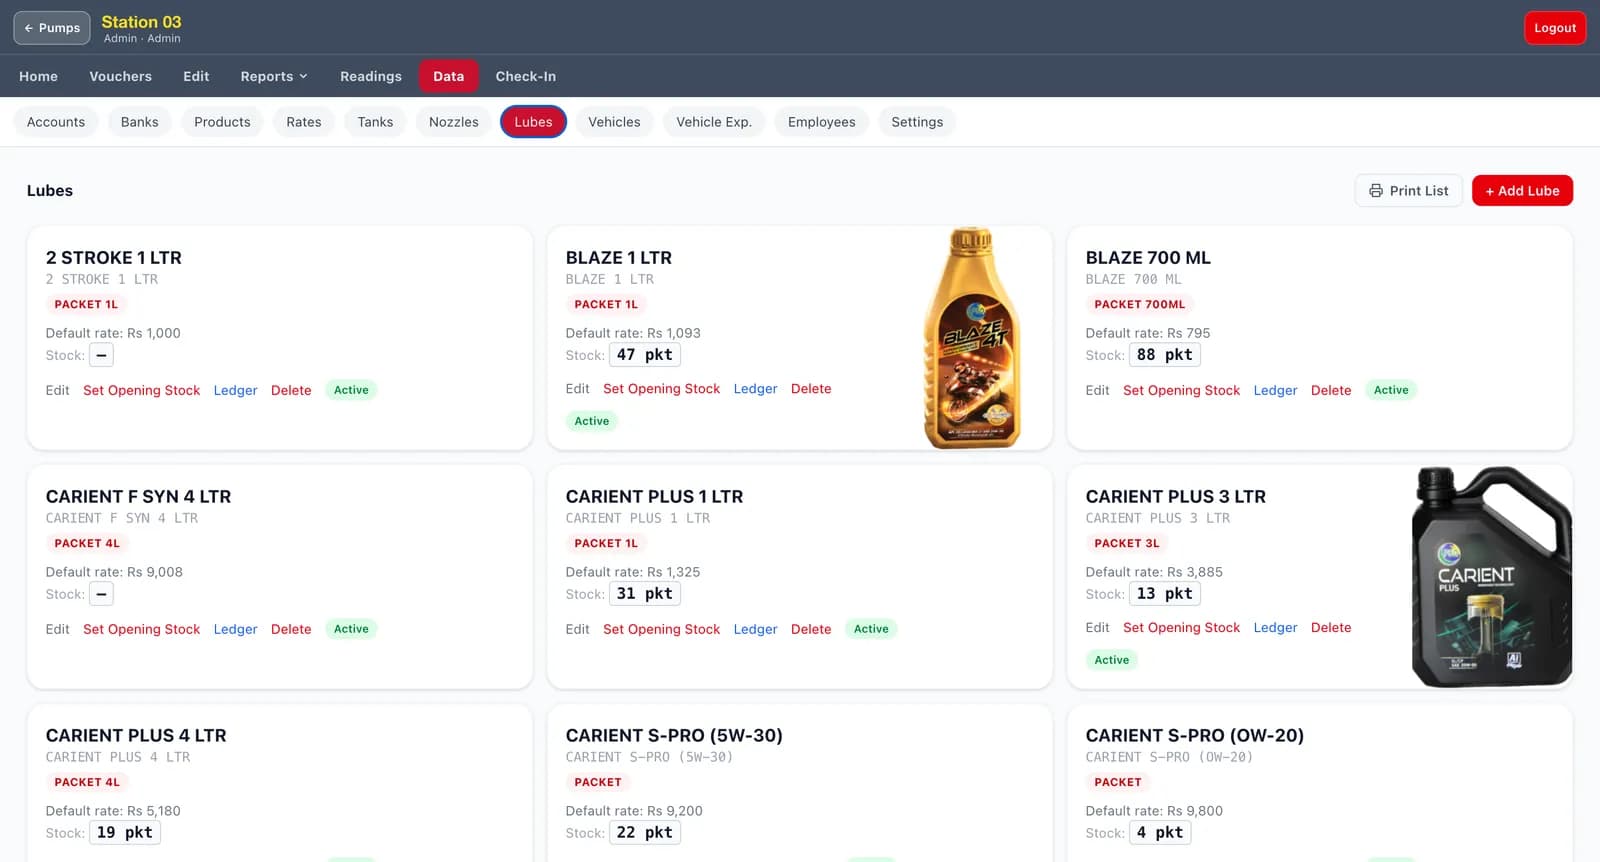
Lubricants are stocked and sold alongside fuel, with per-item stock, default rates, and their own stock ledgers. Vehicles and vehicle expenses, employees, and station check-in round it out.
Outcome
The chain closes each station daily with a variance report instead of a paper tally.
TODO: add real figures — day-close time before/after, variance trend after rollout.
Screenshots

Running a similar operation?
I build systems like this end to end — from the data model to the day-to-day screens your staff actually use.
Get in touch